 See a sample QuestDash
Your VP asks a simple question in a planning meeting: which of your teams is strongest, and which one needs help? You run six teams across product, sales, support and operations. You answer in ten seconds, then wonder how you knew.
Most leaders answer that question from reputation. The team with the polished manager gets credit. The team that shipped something visible last month gets credit. Each of those answers is a story. The manager who tells the best story wins.
To compare teams objectively, measure the work every team shares: making decisions, solving problems, handling conflict, coordinating and leading. Measure it from what the team does, in the same setting for every team, with the team as the unit, and repeat it. AI makes this more pressing, because it moves the slow part of the work from the individual to the team.
Leaders already compare teams with numbers that cannot be compared
You compare teams every time you assign a launch, approve a hire or cut a budget. Most of the yardsticks were built to help one team improve against itself.
Take sprint velocity. A velocity of 40 on one team and 25 on another tells you about each team's estimating habits. Put it on a cross-team chart and teams learn to inflate their estimates. Output counts have the same flaw across functions: fourteen deals and three hundred support tickets sit on different scales.
Even the most respected engineering metrics carry a warning label. DORA, the research program behind the four keys of software delivery, says those metrics "are meant to be applied at the application or service level" and adds: "The goal is to improve your team's performance over time, not to compete against other teams or organizations." It also warns that broad targets raise "the likelihood that teams will try to game the metrics" (DORA).
Engagement surveys record what people say about their team. Global engagement fell to 20% in 2025, from 21% in 2024 (Gallup). That figure describes how people feel about work. It says little about whether a team makes a decision once or reopens it three times.
Self-report has a second weakness: people misjudge their own work. In METR's early-2025 study, 16 experienced open-source developers took 19% longer on tasks with AI tools. They had expected a 24% speedup and afterward still believed AI had sped them up by 20% (METR). METR's February 2026 update treats that as a result about early-2025 tools, and later data pointed to speedups (METR update). The lesson about self-report stands: skilled people misread their own speed.
The manager's slide in the quarterly review measures how well a manager presents. For output metrics that work inside one team, see How to Measure Team Performance Beyond Velocity.
Every team does the same five things
Strip away the function and every team does the same work of being a team. These five behaviors are the common denominator, so they are the one fair basis for comparing an engineering team with a sales team.
Decisions
An engineering team picks between two database designs. A sales team decides whether to discount a stalled deal before quarter end. Both teams either decide once and move, or reopen the question in every meeting. In a 2019 McKinsey survey of more than 1,200 managers, managers spent 37% of their time making decisions, and 61% said most of that time was used ineffectively (McKinsey).
Problem solving
Support hits a bug nobody can reproduce. Marketing sees a campaign stall with no obvious cause. A team that solves problems well narrows the cause, tests one idea at a time and adjusts after a setback.
Conflict
Product and design disagree about scope. Two account executives both claim the same lead. Some teams settle it in the room. Others let it drift into private messages, where it resurfaces a month later as a missed date.
Coordination
An operations team routes a vendor problem to finance, legal and the account owner. An engineering team hands a feature from backend to frontend to QA. Coordination decides whether work lands with the person whose strengths fit it or waits in a queue.
Leadership
Leadership means who steers when the plan breaks, without waiting for the manager. On a sales floor it might be the senior rep who calls the pivot on a deal. On an engineering team it might be the on-call engineer at 2 a.m.
Across all five, how members work together predicts a group's results more than how skilled each member is. In a 2010 study of 699 people in 192 groups, Woolley and colleagues found a collective intelligence factor that predicted group performance across many kinds of tasks. The factor was only moderately correlated with members' individual intelligence (Woolley et al., Science).
Later work confirmed the pattern. A 2021 meta-analysis of 22 studies, covering 5,279 people in 1,356 groups, concluded that "group collaboration process is more important in predicting CI than the skill of individual members" (Riedl et al., PNAS). For the work signals that check these behaviors day to day, see 5 Work Signals That Check a Team Intelligence™ Score.
Situations that call for an objective comparison
Choosing a team for a critical launch or the AI pilot
You have one launch that cannot slip and two teams that could run it. Or you have budget for one AI pilot. Give it to the team that decides fast and absorbs setbacks, so the pilot tests the tools and team friction stays out of the result.
Headcount and budget requests
Three managers each ask for two more people. Comparing how each team routes work shows whether it is short on people or losing time in handoffs. Adding people to a team that decides slowly adds people to the queue.
Reorgs, merges and splits
Before you merge two teams, compare how each handles conflict and who leads. Gartner forecasts that "through 2026, 1 in 5 organizations will flatten their organizational structure through AI, eliminating more than half of current middle management positions" (Gartner). Flatter structures put more teams under each leader, and each leader needs one scale to read them on.
A new leader inheriting several teams
A new director gets five teams and five confident briefings. A comparison on the same scale gives the director a starting line in their first month, before she has learned which briefings to discount.
A manager's leadership record
Managers own their team's result. A manager who wants to show their leadership with evidence can point to a team score that rises over time. The comparison stays at the team level. No individual player is judged on it.
Integrating teams after an acquisition
Acquired teams arrive with their own tools and metrics, which rarely map onto yours. The five behaviors apply to teams in both companies, so they give you one scale for the combined organization.
Spotting a team that is slipping
Results lag behind behavior. A team whose decisions start to stall often misses deadlines a quarter later. A behavior comparison repeated over time shows the slide before the results do.
Learning from the strongest team
When one team stands out, ask what it does differently. Maybe it settles disagreements in the meeting. Name the behavior and other teams can copy it.
Remote, in-office and hybrid set-ups
Among remote-capable US workers, 52% are hybrid, 26% exclusively remote and 22% fully on-site (Gallup). If your teams span those set-ups, comparing hours online or meeting attendance tells you about the set-up. Comparing behavior tells you about the team.
Teams with and without AI tools
If half your teams adopted AI agents and half did not, output volume favors the adopters by default. Compare decisions, coordination and conflict, and you learn whether the AI teams work better together or only produce more drafts.
AI moves the slow part of the work to the team
AI speeds up individual work. In a field experiment with 776 Procter & Gamble professionals, individuals using AI performed at the level of two-person teams without AI, and teams using AI were more likely to produce top-10% solutions (Dell'Acqua et al., NBER). When one person with a tool can match a pair, the slow part moves to the joins between people: who decides, who checks and who owns the result (the arithmetic is in Amdahl's Law for Teamwork).
Faster individuals do not guarantee a faster team. DORA's 2025 report found that 90% of respondents use AI at work. AI adoption now has a positive relationship with throughput and product performance, and still a negative relationship with delivery stability. DORA's own summary: "AI doesn't fix a team; it amplifies what's already there" (DORA 2025).
The team itself is changing too. Microsoft's 2025 Work Trend Index describes an "agent boss": someone who builds, delegates to and manages AI agents (Microsoft Work Trend Index). Once a team includes tools that act, what team means in the hybrid AI era changes with it.
A decision with three AI drafts and no owner
A product team asks an assistant for launch plans and gets three good ones in a minute. They sit in an async thread. Everyone comments and nobody picks. The decision takes two weeks. A team that decides well names an owner and closes the thread.
A disagreement about AI-generated work
A marketer thinks the AI-written landing page is ready to ship. The brand lead thinks it reads generic. If the team argues it out in one meeting and agrees on a bar, the page ships. If the argument moves to side channels, every page reopens the fight.
A handoff to an agent that nobody checks
An engineer hands a migration script to an agent. The agent opens a pull request. The reviewer assumes the engineer checked it, and the engineer assumes the reviewer will. Each handoff between a person and a tool is one more place for work to fall through. A team that coordinates well names who checks each one.
A confident wrong answer
Support asks an AI tool why refunds are failing. It names a cause with full confidence, and the cause is wrong. A team that solves problems well tests the claim before it acts. Another team spends a day fixing the wrong system.
Leading across time zones and tools
Half the team works in Lisbon and half in Denver, with work running through tickets, chat and two agents. Someone has to set the priority each morning and make the call when the plan breaks. A team with strong leadership has someone in each time zone who makes those calls without waiting for the manager.
Output volume and hours online stop telling teams apart, because AI inflates output for everyone. Hours online measure presence. The five behaviors measure where a team wins or loses time.
Five conditions make a comparison objective
- The same setting for every team. Measure one team in a crisis quarter and another in a quiet one, and you have compared quarters.
- Behavior, taken from what the team says and does. Surveys record what people report. Behavior records what the team does. In research drawn from sensor data on about 2,500 people in 21 organizations, patterns of communication were "the most important predictor of a team's success," as significant as individual intelligence, personality, skill and the substance of discussions combined (Pentland, HBR).
- The team as the unit. A sum of individual ratings misses how people work together, the part the research says predicts results.
- Repetition. One reading is a snapshot. Several readings show direction.
- A reading that comes before results. Revenue and delivery numbers arrive late. A behavior measure moves first.
Every comparison has limits
Teams face different conditions, which is why DORA applies its own metrics per service. Measuring also changes behavior. Attach a target to any score and some teams will chase the score, which is the gaming DORA warns about. One number never captures everything a team does. A behavior score belongs next to work results.
QuestWorks puts every team on the same field
One way to give every team the same setting is a shared game. QuestWorks, the Team Intelligence™ platform, runs any kind of team through the same kind of game: a 25-minute, voice-controlled, cinematic quest. The quests are adventure fiction with no tie to any job function, so an engineering team and a sales team play on the same field and their scores can be compared. Inside a story, people stop performing for the boss and play. Players form groups of about 5, mixed up each quest.
The result is the Team Intelligence™ Score, 0 to 100, measured from what the team says and does in play: the decisions it makes, how it handles setbacks, who gets heard and how work gets routed. It updates after every quest and reads before work results do. Each quest targets where the team needs to grow, so the manager gets no homework. Most teams play every 2 weeks.
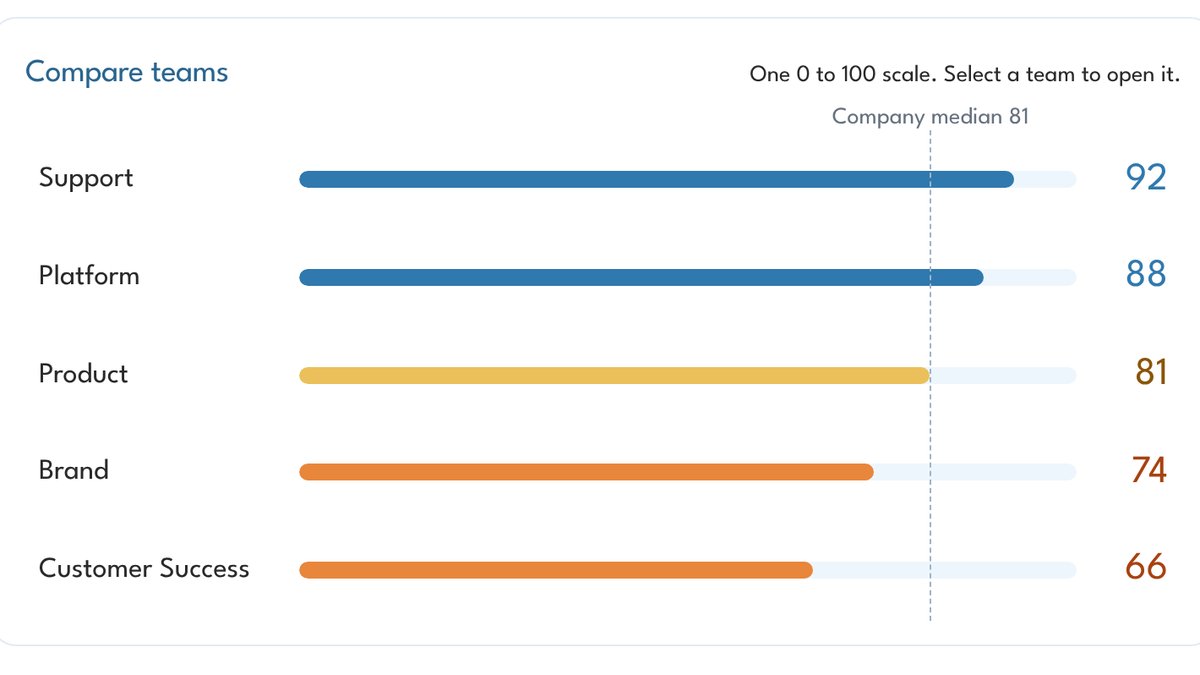
QuestDash, the team lead's dashboard, shows the team's score, its trend and a cross-team leaderboard. Org-level comparison across the company comes with the PowerUp add-on, and benchmarking against teams at other companies is coming soon. Integrations with Jira, Linear and Lattice let work data check what the score predicted. The score belongs to the team, and no individual player is evaluated. The first quest and score are free, with no card. After that, QuestWorks costs $199 a month per team.
Comparing teams fairly comes down to measuring the work they share. AI has made those five behaviors the place where a team gains or loses speed. Measure them the same way for every team, and your VP's question gets an answer you can defend.