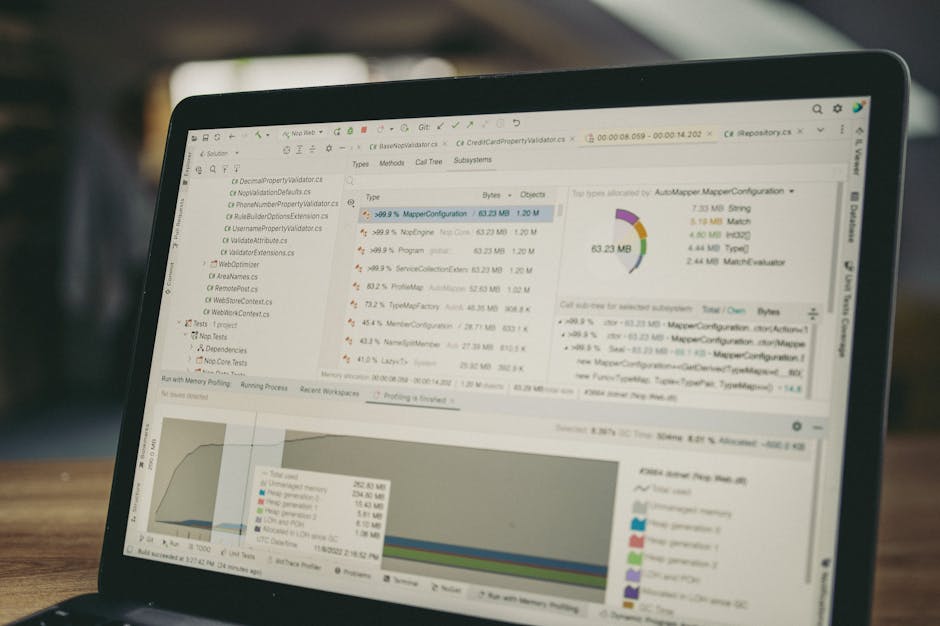
Every engineering manager eventually hears the pitch: connect GitHub, Jira and your CI pipeline, and a dashboard will tell you how productive your team is. Developer productivity tools are a mature category now, and the good ones deliver what they promise. They turn system metadata into cycle time, deployment frequency and review latency with far less effort than a spreadsheet ever took.
They also share a blind spot built into their data source. Commits, pull requests and tickets record what a team produced. They carry almost no information about how the team behaved while producing it: who made the call when two senior engineers disagreed, what happened when a handoff between backend and mobile broke, how the group reorganized when a deadline slipped by a week. Those moments shape next quarter more than any sprint chart, and they leave no trace in Git.
What the Research Behind These Tools Measures
Most developer productivity tools trace their lineage to two research programs: DORA and SPACE. Both are more careful about behavior than the dashboards built on top of them.
DORA
DORA's four key metrics are deployment frequency, lead time for changes, change failure rate and time to restore service, with reliability added as a fifth in 2021. Those four are easy to compute from pipeline data, which is why DORA dashboards are common in this category.
The research program behind them looks much wider. The 2025 report drew on nearly 5,000 technology professionals and more than 100 hours of qualitative data, and much of what DORA studies comes from asking people how they work. In its 2023 report, organizations with a generative culture showed 30% higher organizational performance, teams with a user-centric focus showed 40% higher organizational performance, and high-quality documentation went with 25% higher team performance. DORA gets at culture by asking people how they treat each other, share information and make decisions, and a commit log holds none of those predictors.
SPACE
The SPACE framework, published in 2021 by Nicole Forsgren, Margaret-Anne Storey and colleagues, splits productivity into five dimensions: satisfaction and well-being, performance, activity, communication and collaboration, and efficiency and flow. Its abstract states that productivity cannot be measured by a single metric or dimension.
Git-based tools cover activity and efficiency well. They cover communication and collaboration worst, usually through proxies such as review counts or comment volume. A review comment records that two people exchanged words, and leaves open whether the exchange resolved a disagreement or buried one.
The later DevEx framework narrows the focus to three drivers of the developer's experience: feedback loops, cognitive load and flow state. All three describe how the work feels to the people doing it, which system data captures only in part.
The Tools, and What Each One Reads
Four platforms come up often in evaluations. Their feature sets and plans change, so check each vendor's site for current details and pricing.
LinearB
LinearB analyzes Git, pull request and project tracker data to report delivery metrics such as cycle time. Tools of this kind are most useful for showing where work waits. Pricing is public: Essentials runs $29 per contributor per month with a 50-developer minimum, and Enterprise runs $59 per contributor per month with a 100-developer minimum, both billed annually. There's a 45-day free trial.
Jellyfish
Jellyfish is an engineering management platform built for engineering leadership. It connects engineering work data to business priorities alongside delivery metrics. Pricing isn't published; it's quoted by sales based on seat count and which modules (AI Impact, Developer Productivity, DevFinOps) you select.
DX
DX focuses on developer experience, pairing input from developers with system data. Asking developers gets closer to behavior than pipeline analytics alone, though it still relies on self-report. DX doesn't list pricing publicly; it's demo-and-quote only.
Swarmia
Swarmia reads Git and issue tracker data to report delivery metrics such as cycle time, and it presents itself as oriented toward teams. Pricing is public and modular: a bundled Standard plan runs $45 per developer per month and Enterprise runs $55 per developer per month (both annual billing), or you can buy modules separately from $5 to $23 per developer per month. Teams of up to 9 developers get a free plan.
What they share
All four draw heavily on the same sources: version control, CI/CD and ticketing. Some add developer surveys, which help, though a survey captures how people describe their work after the fact. Pipeline data and surveys both miss the team in the moment a decision gets contested or a plan falls apart.
Why AI Makes the Blind Spot Wider
AI coding assistants have made output metrics harder to read. In DORA's 2024 research, every 25% increase in AI adoption came with an estimated 1.5% decrease in delivery throughput and a 7.2% decrease in delivery stability. The same increase went with 7.5% better documentation quality, 3.4% better code quality and 3.1% faster code review. Individual signals improved while the system got slower and less stable.
The 2025 picture shifted. 90% of respondents now use AI at work, and more than 80% believe it has increased their productivity. AI adoption now has a positive relationship with delivery throughput and product performance, but it still has a negative relationship with delivery stability, and 30% of respondents report little or no trust in AI-generated code.
A dashboard that sums individual activity will show more PRs, faster reviews and cleaner code. It cannot show whether the team has agreed on how much AI-generated code to trust, who owns the review of it, or how the group responds when an AI-assisted change breaks production. Those are team behaviors, and they shape whether the stability numbers recover.
Three Moments No Commit Log Records
1. A decision gets contested
Two senior engineers disagree about an API design. The dashboard shows a PR sitting in review for four days and a cycle time spike. It cannot tell you whether the delay came from a healthy debate, from nobody feeling able to make the call, or from everyone waiting for you to settle it. Each of those needs a different fix, and only one of them is fine.
2. A handoff breaks
The backend team ships an endpoint, the mobile team builds against an older contract, and a release slips. Your tools will show the reopened tickets and the rework. They will not show that nobody on either side asked a clarifying question, or that the person who usually bridges the two groups was out that week. Handoff quality lives in conversations that never touch the repository.
3. A deadline slips
When a date moves, some teams re-plan together in an hour. Others split into separate workstreams and hope someone else raises the flag. Both teams produce the same late deployment in DORA terms. The difference shows up in the next crunch, when one team adapts and the other repeats the pattern.
Aggregates also hide who absorbs the extra work. DORA's 2023 report found that underrepresented respondents reported 24% more burnout and 29% more repetitive work, and women reported 40% more repetitive work than men. A team average can look healthy while a few people carry the repetitive work that keeps it that way.
If several of these moments sound familiar, the free team dysfunction quiz takes about four minutes and points to the patterns most likely at work on your team.
How to Use Developer Productivity Tools Without Being Misled
Keep the dashboard. Output data answers useful questions about flow and bottlenecks. The trouble starts when it becomes the whole picture. A few habits keep it in proportion:
- Keep metrics at the team level. Individual leaderboards invite gaming, the classic Goodhart's law failure, and they reward activity over the collaboration SPACE asks you to measure.
- Pair every system metric with a behavioral question. When review time spikes, ask what happened in the conversation, and whether the team resolved it without you.
- Read trends across several weeks. A single week's snapshot reflects on-call rotations, holidays and one hard bug more than it reflects the team.
- Treat survey data as a starting point. Surveys tell you how people feel about the work. Pair them with evidence of how the team acts under pressure.
- Add a source of behavioral data. Retros, incident reviews and structured practice all produce it. The goal is a record of decisions, handoffs and recoveries, collected on a regular cadence.
For a fuller breakdown of output versus behavioral metrics, see how to measure team performance beyond velocity. If you are building your stack from scratch, the list of best tools for new engineering managers covers the essentials, and the engineering manager playbook covers the habits that make the data useful.
Adding the Behavioral Layer
The hardest part of behavioral data is collecting it without making people perform. People who know a number is being compiled about them tend to perform for the number. Practice under low stakes gets closer to how people act when pressure arrives.
QuestWorks, a team intelligence platform, takes that approach. The whole team plays a 25-minute quest together once a week on QuestWorks' own voice-controlled platform, seated into groups of three to six. Quests create contested decisions, broken handoffs and moving deadlines on purpose, and the way the group responds feeds a weekly Team Intelligence Score from 0 to 100 with an eight-week trend, sub-scores such as Role Clarity, Decision Velocity and Launch Readiness, and a short "Do this week" list of actions. Participation is voluntary, and the data is used for team development, never for performance reviews.
On the output side, QuestWorks connects to Jira and Linear to bring in work-output data, so the behavioral signal from play sits next to what the team ships and the quests adapt to where the team is weakest. It integrates with Slack or Microsoft Teams for setup and invitations.
The tradeoffs are plain. It asks for 25 minutes of the whole team's calendar every week, and a score built from play is one signal among several. It will not replace a delivery dashboard, and the work-tool sync sits in the PowerUp add-on (+$49 per month). Pricing is $199 per month per team with 10 seats included, and there is a 30-day free trial covering four game days, no credit card required. If the question your dashboard keeps failing to answer is how the team behaves when things go sideways, you can try it free.
Output Data Plus Behavior Data
Developer productivity tools answer what the team shipped and where work waits. They are good at it, and most teams past a handful of engineers should run one. The research they cite keeps pointing somewhere else too: culture, collaboration and how people act under pressure predict performance, and those signals live outside the repository. Measure both, and the dashboard stops being the only story you have about your team.
Find out which team behaviors your productivity dashboard cannot see.
Take the free team dysfunction quiz